Bio‑informatics: Integrate negative controls to get the good data
Current day bioinformatics provides mainly solutions and tools to analyze data obtained by high-throughput sequencing of protein-gene transcripts with statistical underpinning. Based on experience with small non-coding RNAs, we propose an alternative heuristic, which demands standard inclusion of negative control data in initial bioinformatics analysis. This approach facilitates a read-counting method that relies only on genomic coordinates and bypasses the need for an overlap with an annotated feature in a reference file.
This heuristic can help to understand other difficulties in the analysis and comparison of read-count data. It can be argued that all RNA is a product of gene-transcription and falls therefore into the same category, thereby posing the same problems to solve. This turns out to be, at least practically, too simplistic a view of the plethora of high-throughput data that can be generated. For example, selective RNA sequencing raises problems that require solutions different to those commonly applied [1]. One of the difficulties relates to how relative changes between independent libraries can be quantified. The prevalent practice centers on applications designed to measure differential gene-expression, like Deseq2 or EdgeR. The internal standards required for normalization by these tools go missing when sequencing data do not directly represent transcription. The link with transcription is severed when the biological process generating the RNA follows a different route like occurs during amplification of siRNA or after the pool of unrelated, unchanged transcripts that form the internal standard is lost by selective enrichment of the input RNA [2].
The method we propose deals with an ongoing problem in bioinformatics analysis of high-throughput data, that of distinguishing meaningful information against a backdrop of noise and accidental peaks which, by their omnipresence in repeats of experiments with various substrates, appear to be linked to methodology rather than inputs. This problem further extends to meta-analysis of various independent datasets if this complication is not recognized [3]. We show, using ribosomal RNA fragments (rRFs) as an example, that novel insights cannot solely be based on large numbers that appear to promise statistical significance:
As a major part of negative control data, rRFs do not bind specifically to Argonaute proteins
We have developed a Python application to systematically clean up datasets before their further analysis [4]. This step happens normally ‘behind the scenes’ but we think that making this explicit serves reproducibility, accessibility of the ‘real’ information in a dataset, and trustworthiness of derived conclusions. Despite the blatantly obvious we state for many colleagues, we hope our approach will be useful in general and inform people less familiar with experimentation. The crux is this: bring essential biological methodology, the Bio, into bioinformatics; integrate experimental control data into the mathematical analysis. Experimenters do not just generate data, they produce data and control data; the latter are key to draw valid conclusions from the former. What is meant by control data?
Control data
Biological experiments encompass approaches that historically precede but are conceptually similar to machine-learning methods when training is done on ‘bad’ vs ‘good’ examples in the data.
Experimental success lies in the pragmatic possibility to make a proper assessment. That is, from the output of the experiment a conclusion concerning some hypothesis on a biological system can be drawn. Experimental results come in various shapes and forms, from a gel-image to a long list of nucleotide sequences in high-throughput RNA sequencing (RNA-Seq). These results can only be meaningful if standards are present within the experiment to evaluate the overall output against. This because a biological experiment involves components that are not fail-safe. Reagents can expire and no longer be active [5]. Other problems relate to methodology. For example, in small RNA sequencing the short molecules isolated are always mixed with remnants of longer molecules. A size-selection step during the RNA and/or cDNA library preparation will not resolve this difficulty. In general, RNA-Seq libraries will contain contaminants because of electrostatic interactions between nucleophilic molecules in the starting input or when these molecules have some affinity to materials used during the preparative steps. To address such issues biological experiments contain internal tests for proving that outcomes obtained with the followed procedures would have been valid. This also holds for high-throughput sequencing techniques [Esteban-Serna].
The standards that render the internal tests are called the positive and negative controls. The negative control is a sample that is not expected to provide an informative answer; a negative control, also called ‘mock’ control, shows the noise in the experiment. In contrast, a positive control should give output that is specific, i.e. adheres to the current knowledge available for the biological system under study. It tells that the experimental conditions produced a useful answer. To assess the effect of a mutation (or another condition) is to check what happens to the specific output relative to that of the controls.
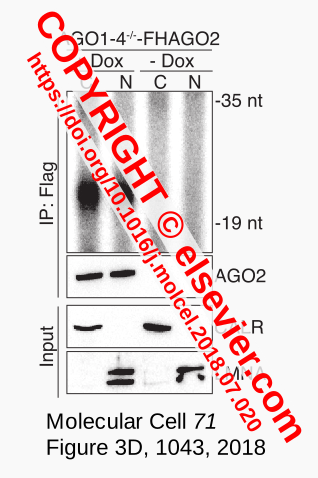
Figure 1. Input RNA.
The noise of the negative control, the meaningless signals that are also expected for other samples in the same experiment, can be seen as the ‘bad’ examples in a machine-learning training set. Such noise is visible as a diffuse smear in a biochemical analysis of RNA used for the construction of cDNA libraries in RNA-Seq. For example, in a study of microRNAs by Sarshad et al. [Sarshad-2018] the gel-image of Figure 1 (taken from their Figure 3D) shows radioactively labeled RNA that is representative for RNA-Seq input. The RNA was purified from cells that only produce one functional Argonaute protein (AGO2) after induction of the gene expressing an epitope-tagged variant (+ Dox). The protein was isolated by immunoprecipitation (IP:Flag) from two cellular fractions (cytoplasmic, C and nuclear, N). The same procedure was done with cells that were not induced (- Dox) and therefore not expected to make AGO2. In this experiment, the - Dox samples are the negative control to ensure that output obtained for the samples of real interest (+ Dox) can be trusted. The latter samples could be dubbed the positive control because the experimental outcome showed the co-purification of AGO2 with a size-restricted population of RNA molecules (the fat black band at the level of :F in the label IP:Flag). This was in agreement with the methodology and published findings that miRNAs of ~22 nt bind to Argonaute proteins in mammals. Other controls in this example are for correct fractionation into cytoplasmic components (CALR) and nuclei (LMNA).
The absence of tagged protein in the - Dox samples demonstrated that the gene was not expressed and indicated properly working induction and immunoprecipitation procedures. Visual subtraction guides the researcher to the conclusion that only the fat band in the lanes of the positive samples represents the meaningful outcome of the experiment: the signals common to all lanes, the background smears, can be ignored. But not for the follow-up experiment. The RNA smear, visible in the - Dox lanes, is still present in the positive samples and will be part of the input for RNA-Seq, which was subsequently done on all four samples to enable a similar comparison with respect to the sequencing results.
In the discussion of their results, Sarshad et al. [Sarshad-2018] only mention the relevant data, the miRNAs isolated from the + Dox samples. Still, the - Dox dataset would have been used to determine which sequencing reads could be ignored in the + Dox data, enabling identification of sequences that specifically associate to AGO2. This filtering is common practice and hardly mentioned or properly explained in publications, which impacts reproducibility. In other words, this essential step can easily be overlooked, especially by non-experimenters, and is possibly the reason negative data sets are not taken into account by at least some meta-studies. This is one of the problems we discuss in this paper, and which we have addressed by developing a Python application to systematically clean up and count (small) RNA sequencing results.
High-throughput datasets can be full of noise.
The strategy of ruling out ‘bad’ examples as in a machine-learning training set is evident when experimenters remark that some particular hits were not used or filtered from the dataset [7]. Statements concerning omitted reads are indicative for the fact that high-throughput data always contain sequences different from those that are of interest or relevant for the system under study.
When purifying reagents, which determines the success of an experiment, irrelevant molecules can be fished out from the input-sample. This will minimize contaminating signals in the eventual output. Depletion kits make the RNA-Seq more efficient by improving the coverage for data the researchers are interested in. Other experimental approaches are abound with a similar aim of improving the signal to noise ratio. For example, as described above, selective purification of an RNA-binding protein and then sequencing the associated RNA helps to narrow down the population of RNA molecules the protein interacts with [8]. Cross-linking techniques have been developed to enrich even more for biologically-relevant over spurious molecular interactions, be it between proteins and RNA [9] or between RNA-molecules bound to a protein of interest [10].
The words ‘narrow down’ and ‘enrich’ are necessary: noise, although reduced, will remain. Both cDNA library construction and the sequencing reaction involve PCR amplification steps. This means that the noise will be increased along with the signals. Therefore, as illustrated below, the noise can form a more substantial portion of the RNA-Seq output than expected with input of good quality as exemplified by Figure 1. Such background corresponds to the category of ‘unlikely’ reads that have significant overlap with peaks in samples extracted from a ‘blank’ control in Figure 2 of [Esteban-Serna].
The take-home message here is that RNA-Seq data are not ‘clean’; they are messy and not usable as is. To draw reliable conclusions from the data, the irrelevant noise has to be put aside. We propose to make this taken-for-granted aspect of the data analysis explicit and to systematically remove the noise by following common biologists’ practice of using negative controls. We demonstrate how this essence of experimentation can translate to a bioinformatics approach.
Bioinformatics with negative controls

Figure 2. Specifying bedgraph signals
Coalispr (COunt ALIgned SPecified Reads) [6] consists of a collection of Python scripts for quick, selective comparison and visualization of high throughput sequencing data. The program dissects the data per chromosome using bedgraphs for input and helps to retrieve read counts from associated bam files. For relatively small fungal genomes, it can display over 100 bedgraphs in one panel.
The program mimics the visual subtraction between positive and negative samples referred to above, but acts on bedgraph traces, as illustrated in the schematic of Figure 2. For each sample, stranded bedgraph data are tabulated per chromosome [11] by splitting and summing over bins [12]. Tabulated bin values are then compared between negative and positive samples. When a bin contains hits in a negative control, while comparable values are found for other samples, the reads in that bin are taken to represent a background signal. These reads are dubbed ‘unspecific’ (U) and can build a low signal, but when they derive from very abundant molecules like tRNA or rRNA, they accumulate and form substantial peaks in the bedgraph traces. Therefore, in order to distinguish such high levels of noise linked to the applied methods from signals specifically detected by the experiment, comparison with negative control data is key.
Specific signals (S) are marked by bins that mainly contain reads in the case of the positive controls or mutant samples. These bins show coverage for reads representing RNAs that can be linked to a condition under study or the protein they have been co-purified with. These reads are (mostly) absent from negative controls, so that the difference in coverage rather than signal intensities is used as the leading parameter to specify reads as specific or unspecific. While the difference in coverage is the major determinant, various configuration settings [16] help to define segments with specific signals (the remainder being unspecific). A base level is set below which signals are not taken into account. The second parameter sets a threshold as the fold-difference between specific and unspecific signals in the case reads of positive controls and those in negative controls overlap. Then, to account for missed or dismissed data, the tolerated gap between genomic peak coordinates can be set to define a contiguous segment for counting reads.
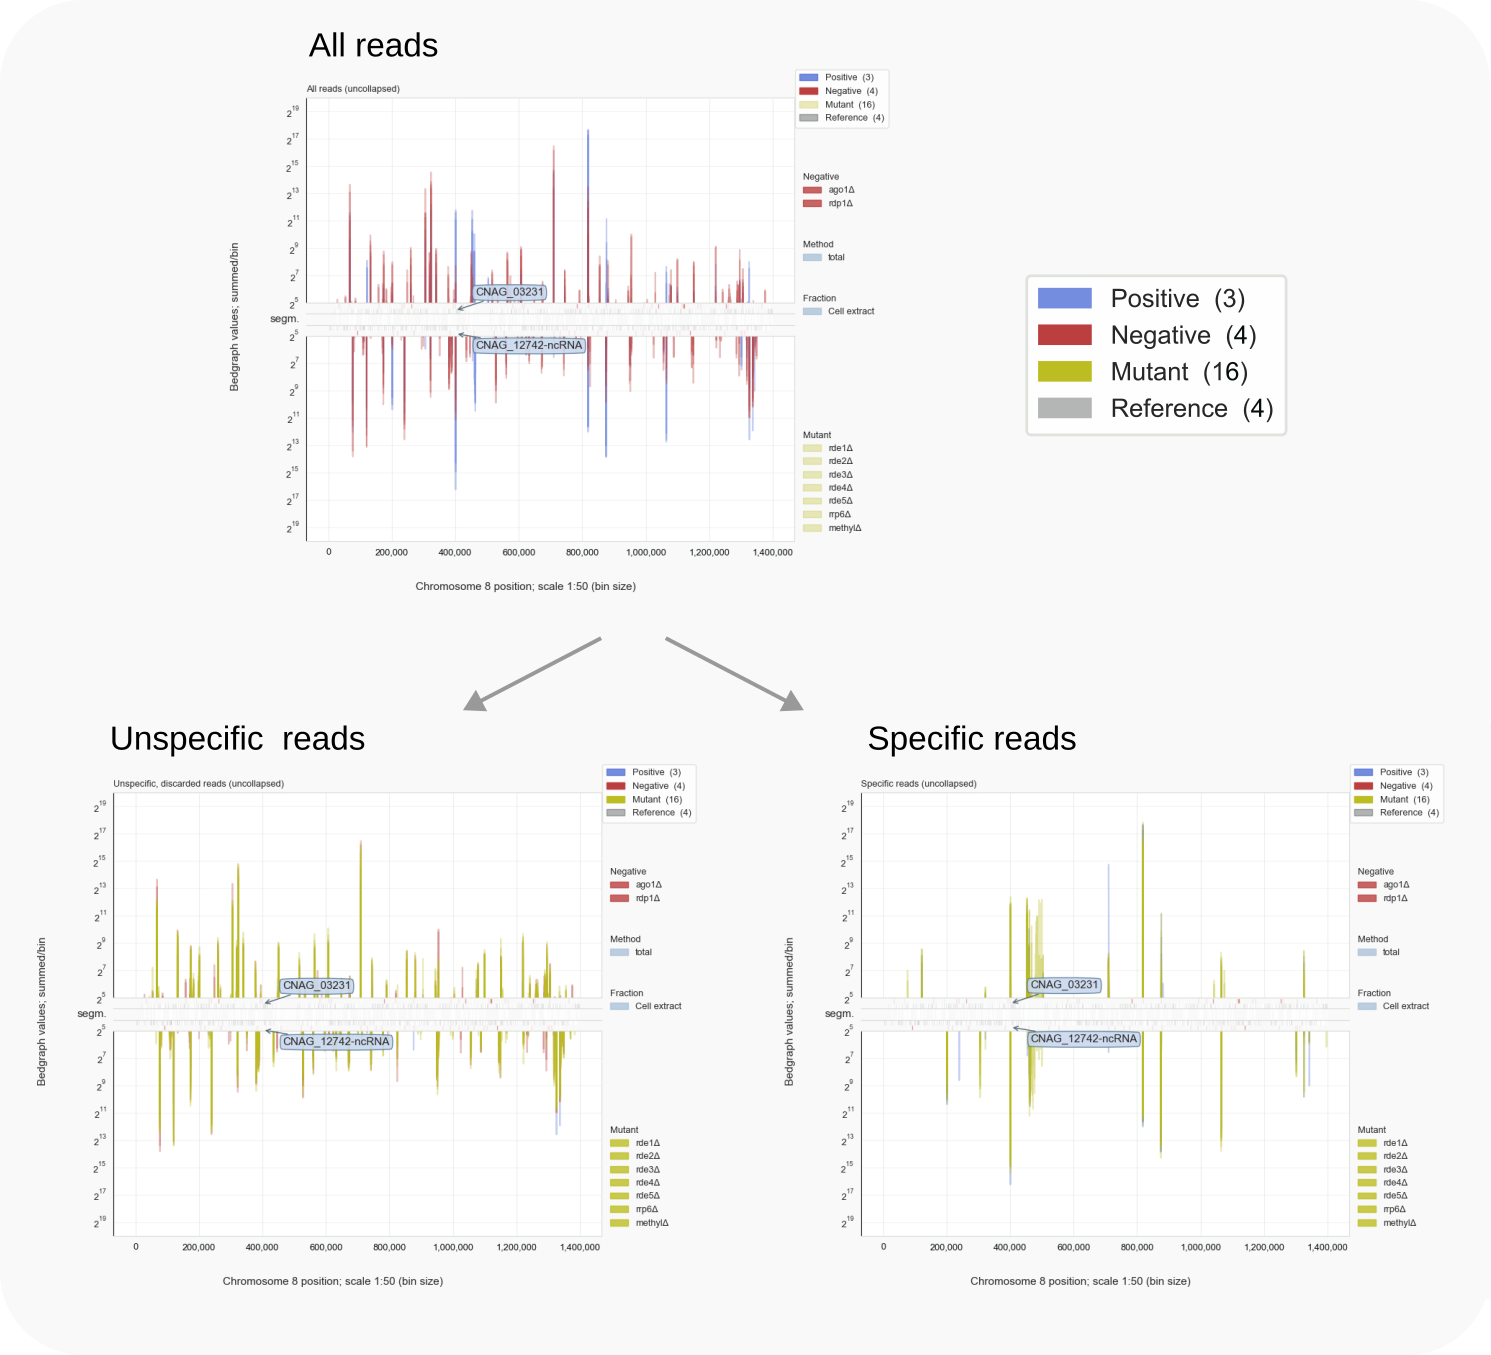
Figure 3. Specifying reads by comparing controls [15].
Comparison of read signals collected in bins, instead of directly per nucleotide, is a pragmatic decision. It enables tabulation of all data and thereby the application of vectorization [13] techniques to process all samples in one go (here with the Python module Pandas). Re-organizing bedgraph signals to a common index (bin-related coordinates) reduces the resolution [14] but is the pivot of the approach. Binning concentrates reads which better defines difference-trends when read coverage is variable between samples. The reduction in resolution helps to distinguish genome regions with specific signals from those with unspecific, background peaks. This sorting, preceding subsequent counting and other analysis steps, is the main, novel contribution of Coalispr to current bioinformatics and highly relevant when size-selection steps cannot reduce contaminating signals, as is the case for small RNA-Seq. An example of peak-sorting into the two categories by Coalispr is shown in Figure 3.
Counting reads
… without reference to an annotations file.
Apart from visual comparison of data-traces, the program has been developed to obtain count-data [17] for small non-coding RNAs. Genome annotation files for most organisms lack information on such RNAs, while programs like HTSeq [Putri-2022] or pyCRAC [Webb-2014] base counts on annotated features. Thus, to count small RNAs with these programs, an annotation file has to be prepared from scratch [18]. This is laborious, error-prone and not very scalable to other organisms or when a major update of the genome is published. By incorporating negative control data in the analysis, the bin-comparison helps to distinguish meaningful reads. With this approach, applied by Coalispr, it is possible to systematically obtain read counts for various kinds of data.
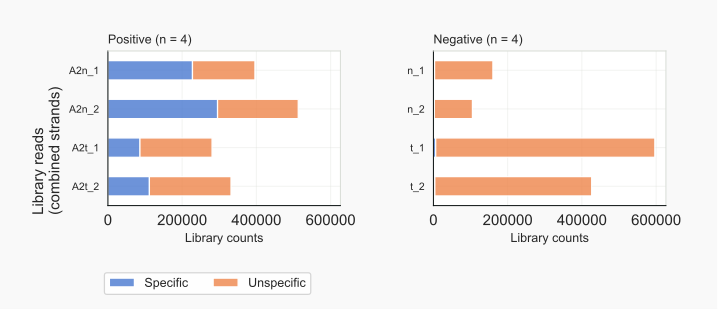
Figure 4. Counts for specified reads.
The separation of reads into those that fit the positive controls and those that are common to all samples (i.e overlap with negative controls), categorizes reads as specific or unspecific. By this process also the chromosomal regions are defined that link to these categories. Counting of reads can thus be based solely on genomic coordinates in sorted bam alignment files the bedgraphs derive from, not requiring an overlap with an annotation reference [18]. The program implements this principle and supports fast counting of reads when these have been collapsed prior to the mapping. Such collapsing takes all identical sequences as one, but tracks the total number that represent a cDNA [19].
Dividing reads into specific signals and unspecific noise, shows that a large fraction of the positive control reads overlaps with those of the negative control (Fig. 4). This was to be expected because of the background smear being part of the input for the RNA-Seq libraries. The characteristics of the grouped reads are very different. The majority of AGO2-associated RNAs are 22-23 nt, conforming to expected lengths of miRNAs, and have an A as the 5’ nt. Unspecific RNAs are more diverse in length, with RNAs of 31-33 nt starting with a G most prominent (Fig. 5).
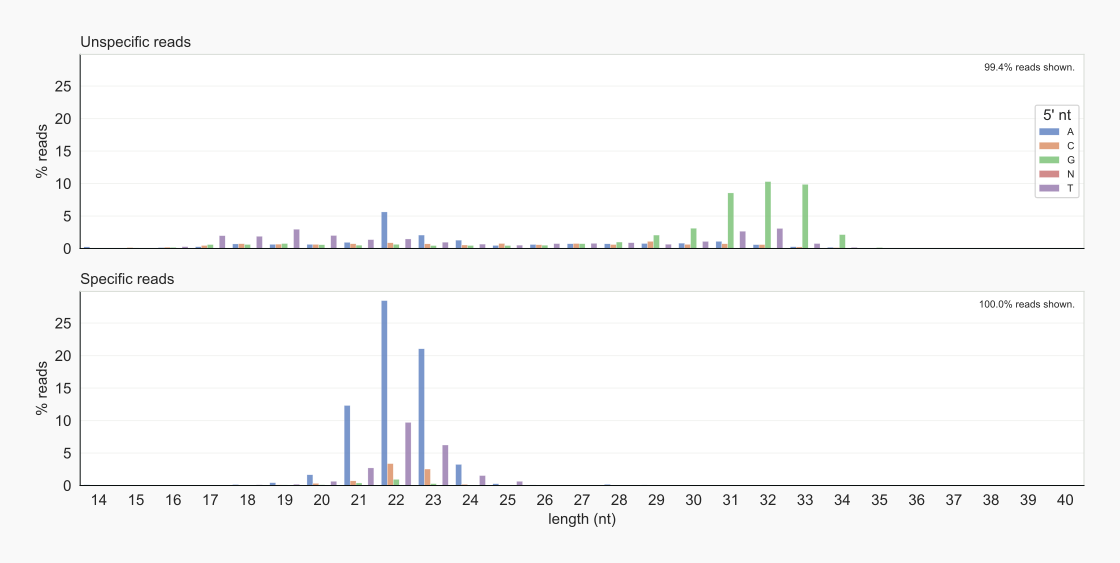
Figure 5. Lengths and 5’ nt of specified reads [22].
Ribosomal RNA hits
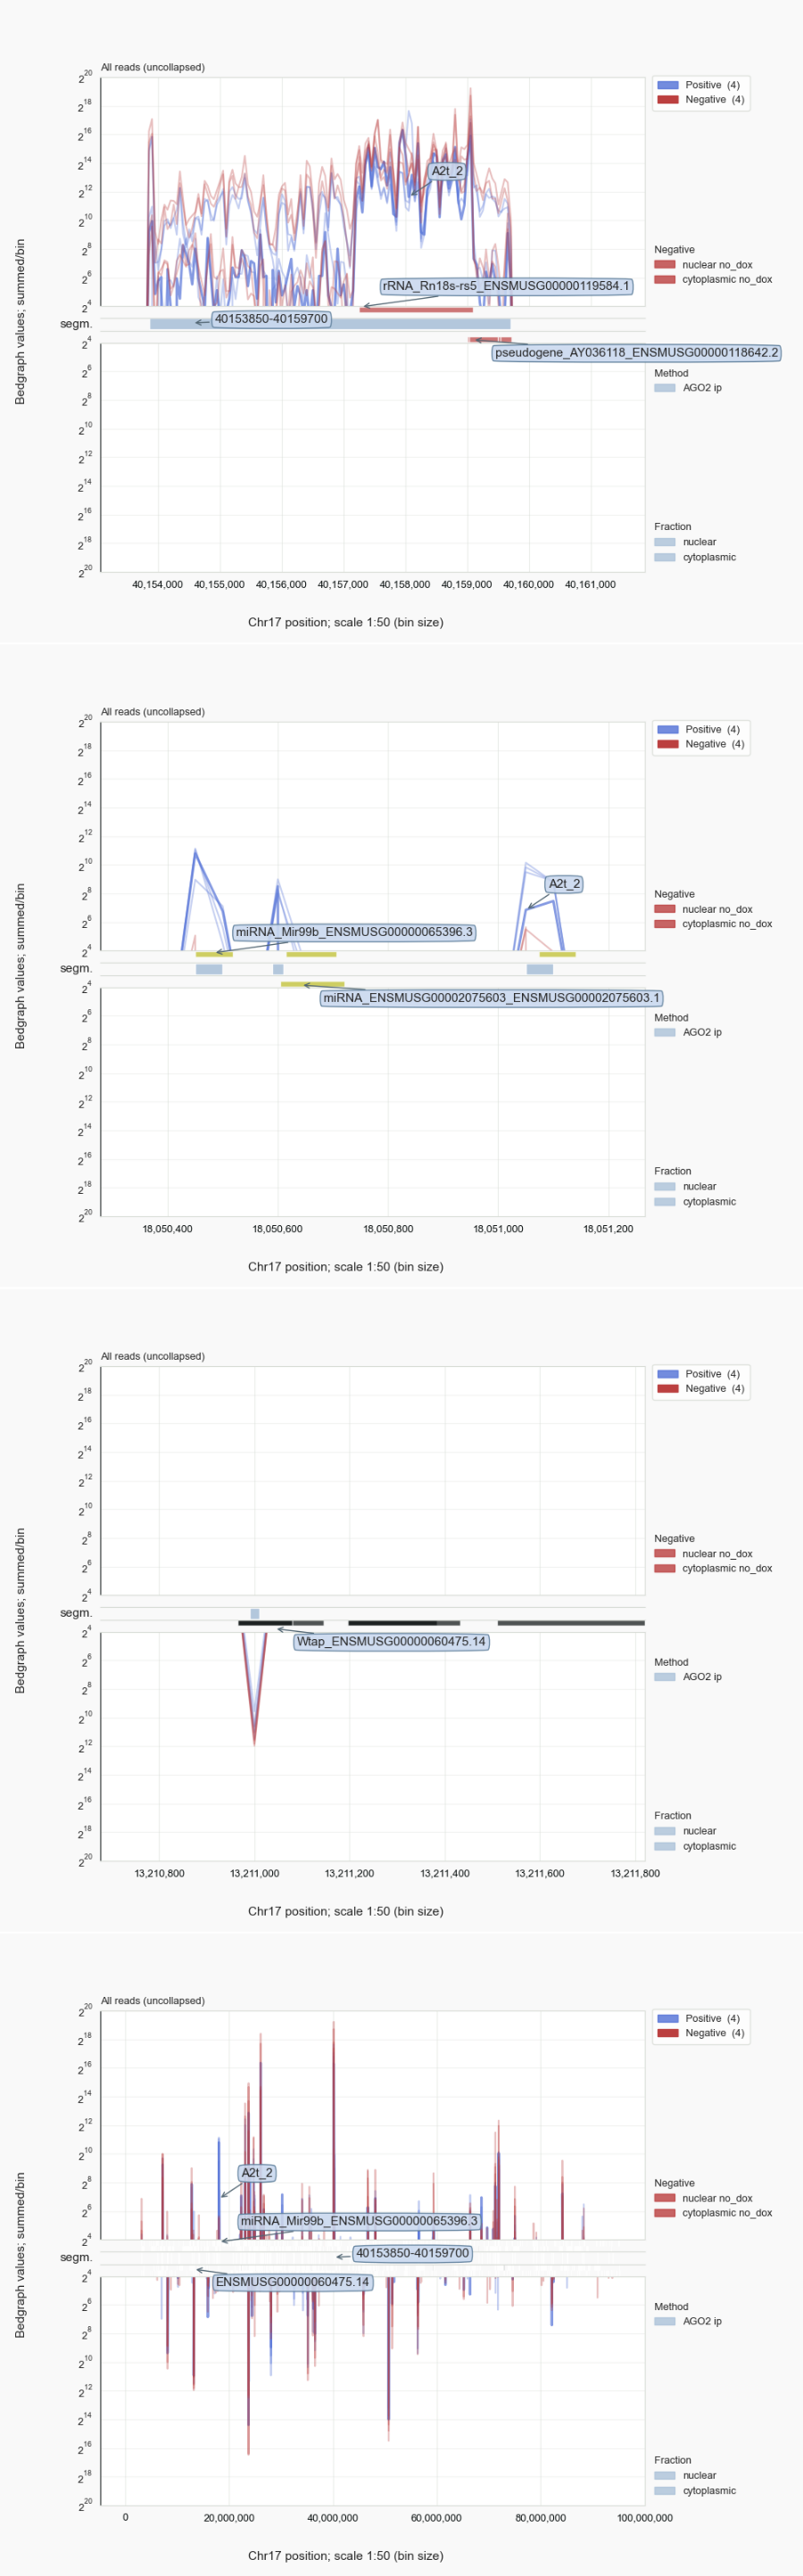
Figure 6. Trace analysis for chr. 17
Very abundant cellular complexes like translating ribosomes are a source for fragments (rRNA, tRNA, or highly expressed mRNA) that create unwanted background signals in RNA-Seq data. Most ribosomal fragments (rRFs) originate from very long (precursor) molecules. This section describes the analysis of rRFs in datasets by means of Coalispr.
Mouse miRNA data
Mammalian ribosomal DNA repeats encode 45S pre-ribosomal precursors. Of these rDNA repeats, an 18S unit on chromosome 17 [25] is annotated for the reference genome used by Sarshad et al. [Sarshad-2018]. The display of Figure 6, generated with the command coalispr showgraphs -c chr17, shows traces for nuclear and cytoplasmic negative controls (red) that are indistinguishable from those for the AGO2 IPs (blue) in the case of sequences mapping to rDNA (top). Compare this to loci for miRNA genes, expected to be covered by reads associated with AGO2 rather than those isolated from the uninduced samples. This can be seen in the range (18050000, 18052000) on chromosome 17: there is an miRNA cluster of Mir99b, Mirlet7e, and Mir125a (while ENSMUSG0000207560 was not detected). When the complete 45S rDNA unit is included in the genome for mapping the sequenced RNAs against, no major change was observed for AGO2-specific reads, while cDNAs derived from rRFs were comparable for all samples for covering the 45S rDNA region (Fig. 7, top). No group of rRFs or rRFs-derived cDNAs could be discerned, incl. those that adhered to the characteristics of miRNAs, that stood out in positive samples compared to the negative controls with respect to length and 5’ nucleotide (Fig. 7, bottom). These observations indicate that, despite being among the most abundant reads in this dataset [26], rRFs cannot be proven to be specifically associated with AGO2. This outcome undermines published meta-analyses claiming such a role for rRFs, a suggestion that originated from the over-optimistic assumptions that input RNA had been sufficiently pure and that background in the form of a smear on gel would not produce relevant count numbers in RNA-Seq. This would all have been preventable had their bioinformatics analysis incorporated available negative control data; rRFs are not co-purified with mouse AGO2 because of a biologically meaningful interaction.
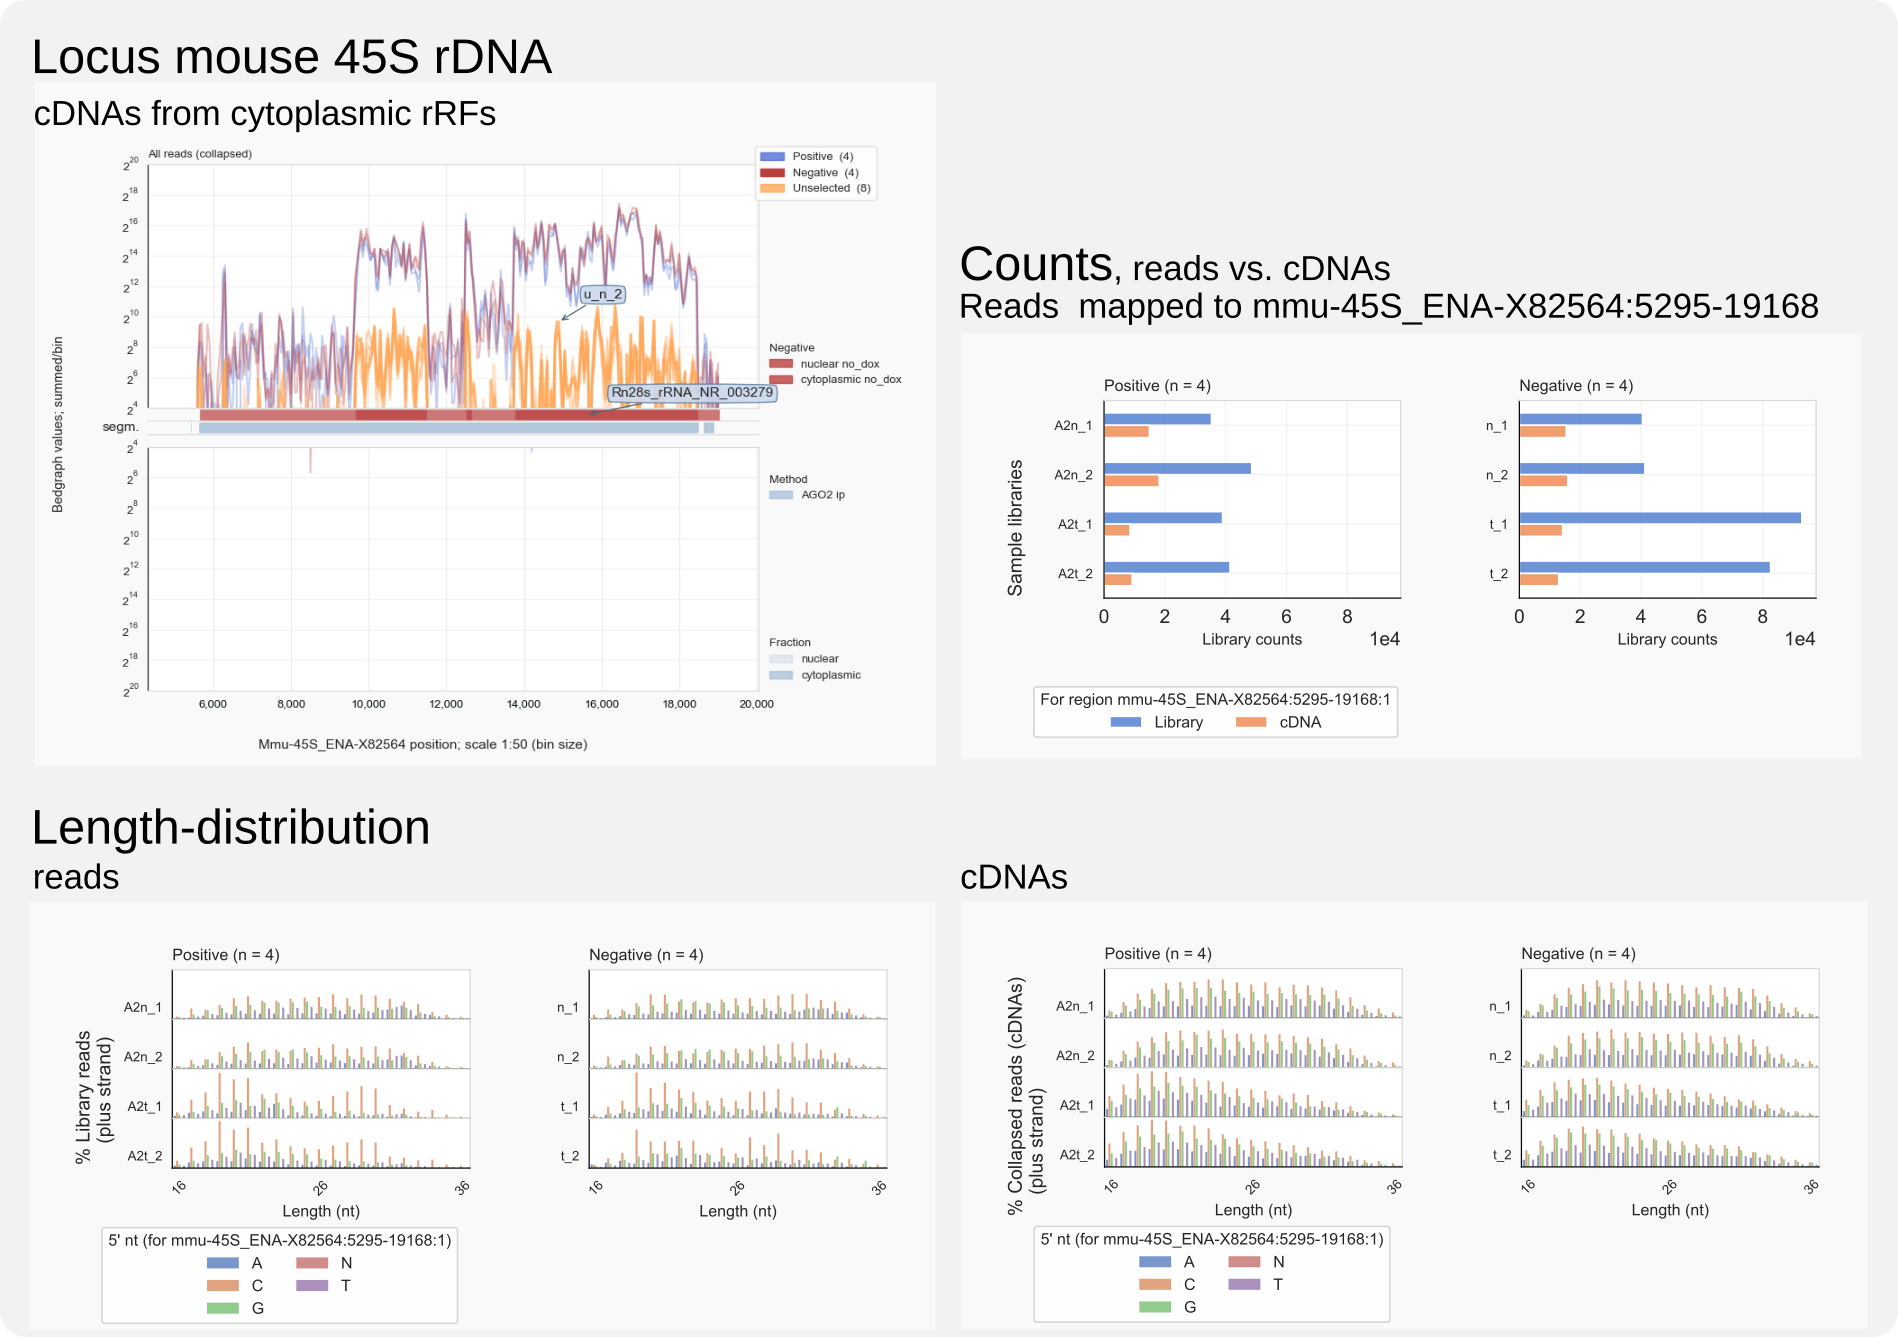
Figure 7. Mouse 45S derived rRF-cDNAs and rRFs.
Yeast pre-rRNA processing factors
The finding that rRFs are common to all samples does not mean they cannot represent specific interactions between rRNA and proteins. Techniques based around UV crosslinking of RNA to the proteins of interest before purification [9] have been developed for exactly this purpose, identifying binding regions for processing factors involved in ribosome assembly and rRNA maturation [Granneman-2009, Granneman-2010, Granneman-2011]. Despite the stringent and harsh purification procedures applied in these approaches, background signals from abundant molecules cannot be evaded. Samples that have not been irradiated can be taken as negative controls but in the case of tight complexes or strong interactions this is not ideal. An alternative way to assess noise is by comparing crosslink data for different, unrelated RNA-binding proteins [27].
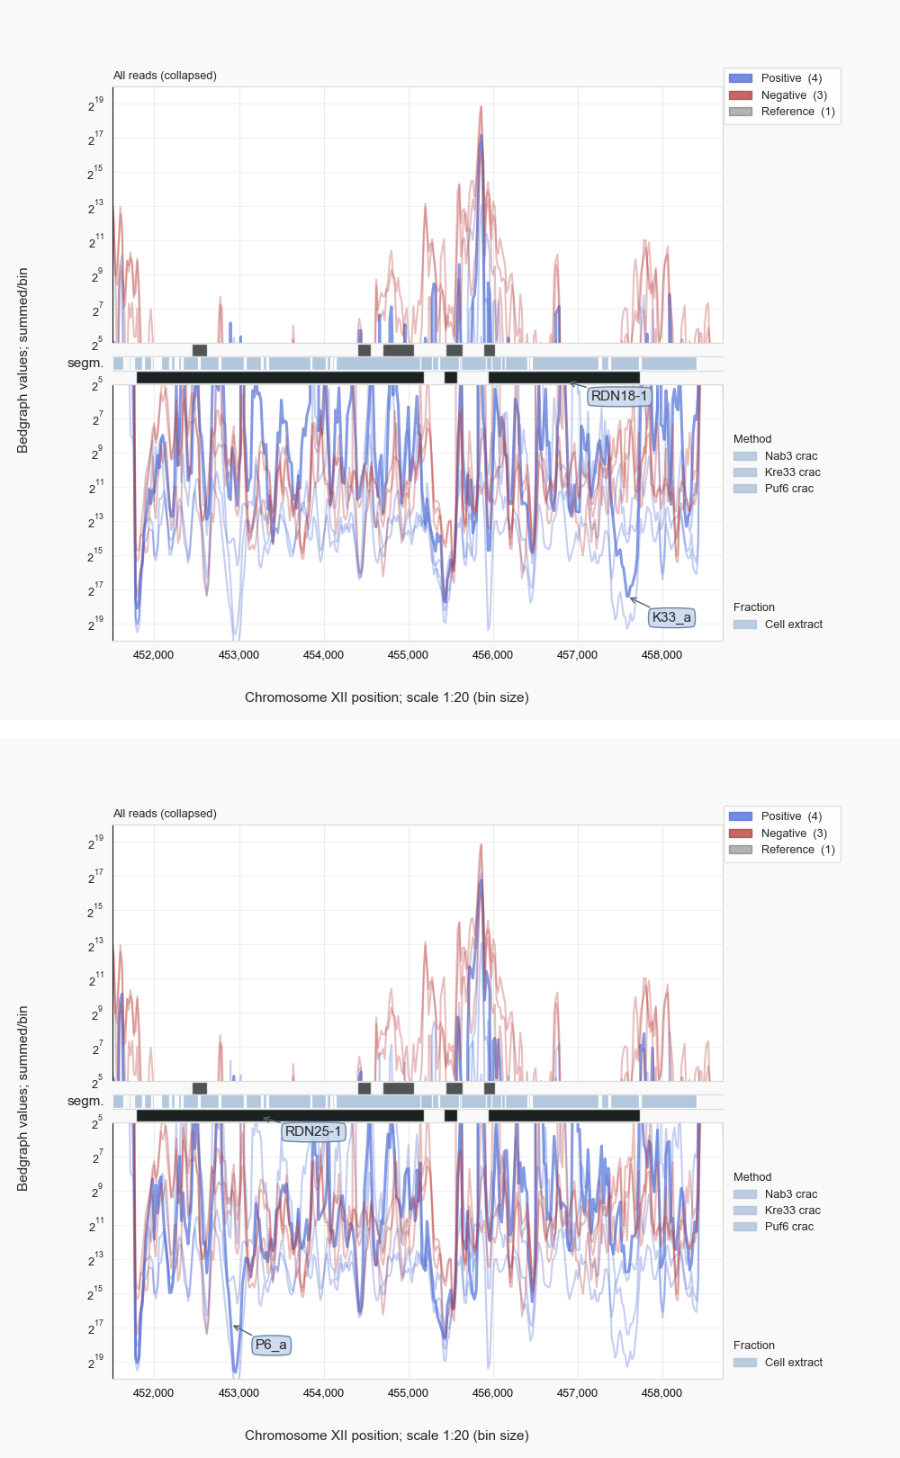
Figure 8. rRF reads
To illustrate how noise can be filtered by using data-sets as mutual controls, various CRAC-samples [9] obtained for processing factors Kre33 [Sharma-2017], Puf6 [Gerhardy-2021], or termination factor Nab3 [van.Nues-2017] were compared (Fig. 8). Kre33 directs acetylation of cytosine residues in helices 34, and 45 in the 18S rRNA (within the 90S pre-ribosomal particle) and associates with helices 8-10 [Sharma-2017]. Especially the latter region stands out from the non-Kre33 traces. Similarly for Puf6, which crosslinks to helices 67-68 of 25S rRNA in the large subunit precursor [Gerhardy-2021]. The more detailed pyCRAC [Webb-2014] analyses published [Sharma-2017, Gerhardy-2021] back the specific association of rRFs with Kre33 or Puf6 by the presence of point-deletions of uracil residues in reads that result from UV-crosslinking of the RNA to either protein [29].
These results underline the experiential fact that abundant, spurious rRFs are identified in RNA-Seq libraries despite the stringent purification procedures applied. Any assessment whether rRFs in RNA-Seq data can be linked to a biological role requires proper controls and independent experimental evidence supporting such a function.
Fungal siRNAs target rRNA
Most high-throughput analyses catered for by bioinformaticians deal with data obtained for mRNA or RNA fragments that are co-purified with proteins they bind to (with or without cross-linking) and rely on extensive gene-annotation files [18]. With Coalispr an alternative way for obtaining count-data has been implemented, which is based on genomic coordinates identified by aligning reads to a reference genome. This is the only feasible approach to interpret RNA-Seq data for classes of short RNAs, like siRNAs that have not (or poorly) been annotated.
In Cryptococcus, RNAi acts downstream of splicing.
The development and testing of Coalispr has relied on comparison to count-data obtained with HTSeq using manually accumulated reference files for siRNAs of Cryptococcus [Dumesic-2013, Burke-2019] [30]. Compilation of complimentary genomic regions provides the insight that siRNAs, contrary to what has been published [Dumesic-2013], are raised mostly against transcripts that have undergone splicing. Naturally, the possibility that splicing was not entirely complete remains [31], so that retained introns could be one of many causes for translation failure [32]. Such faults, which would be encountered during interaction of spliced transcripts with ribosomes, could turn these transcripts into targets of the RNAi-machinery.
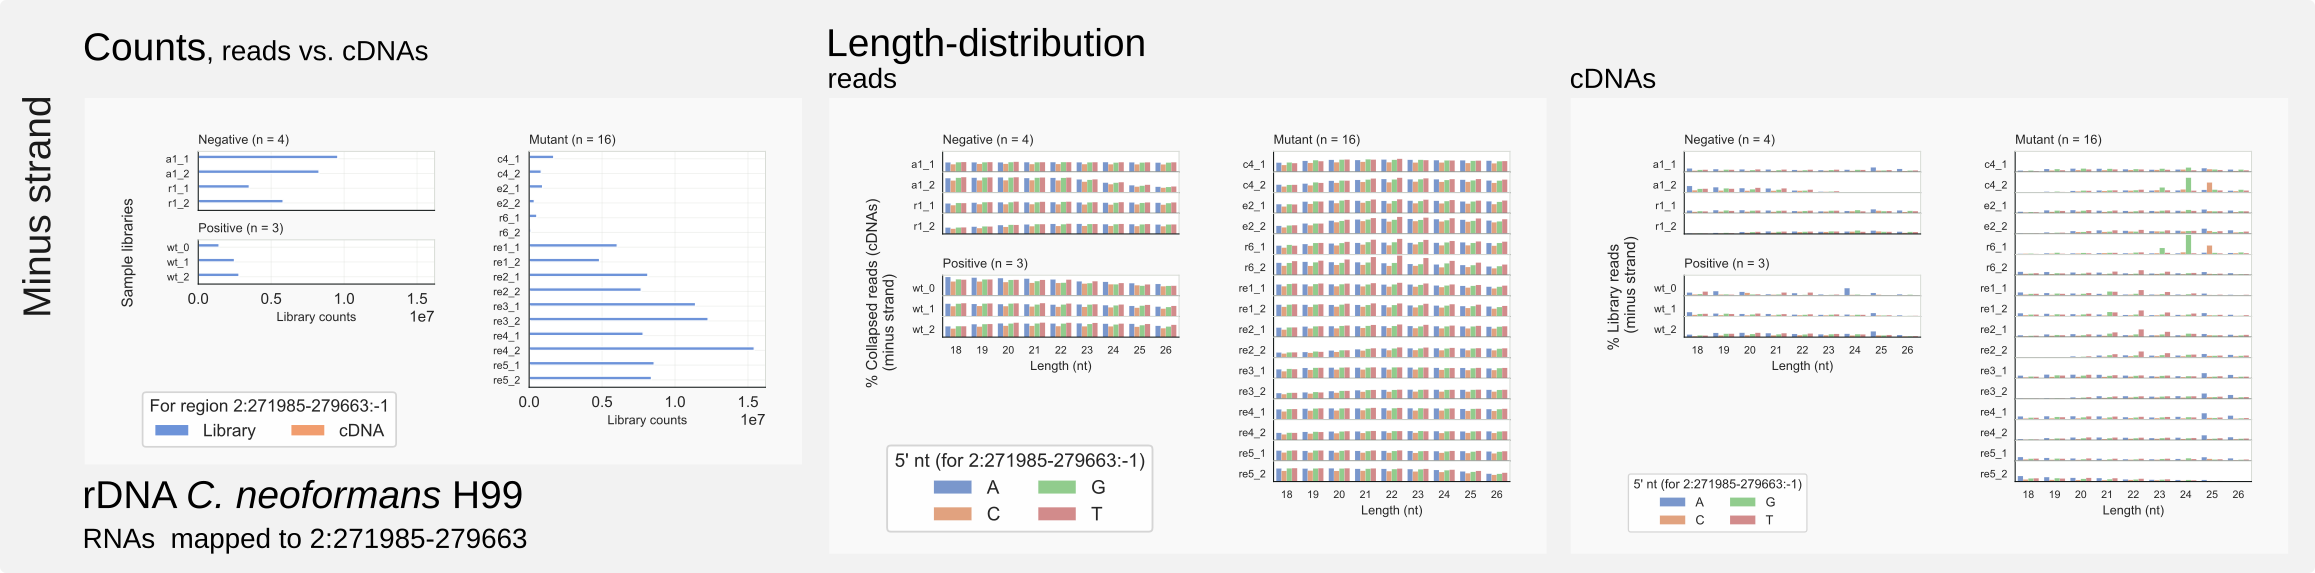
Figure 9. Minus strand counts for C. neoformans rDNA.
In this respect note-worthy, is the finding of siRNAs associated with Argonaute proteins that are directed against mature rRNA. This is seen for C. neoformans [34] as well as C. deneoformans, but, in the case of the latter, especially after the RNAi response has been restored in cells that did not express their main Argonaute protein, Ago1 [Janbon-2010], or Rdp1 [van.Nues-202?]. Another ncRNA associated with ribosomes, SRP RNA, can be targeted by siRNAs (Fig. 10).
Comparable to the mouse miRNA datasets, large amounts of rRFs were detected in cryptococcal siRNA libraries [30] [34]. The RNAs derived from the rDNA unit, however, cannot provide any information because no reads are specifically enriched among rRFs in Cryptococcus that would fit the siRNA binding pocket on Argonaute (Fig. 9).
Small RNA count data are problematic
… by lack of an internal control as available for differentially transcribed protein genes.
The main aim of Coalispr is to sort signals from noise. Peaks in bedgraph traces (loaded with coalispr storedata) are specified as specific and unspecific and this process can be followed by comparing the output visually, using coalispr showgraphs (see Figures 3, 6-8). The specified reads are then counted (with coalispr countbams) and these counts, stored in tsv files, can be used for further analyses. Read-counts can be indicative for the quality of libraries and general experimental outcomes, which can be visualized with coalispr showcounts (see: Figure 4 or Figure 5). The main interest, however, will be in comparing the counts between samples for the same RNA in order to understand the biological effect of a specific condition or mutation. For this, read counts need to be normalized, which is problematic for small RNA sequencing data. Why?
Because of the variability in library depth, often related to practical difficulties during preparation and recovery of the cDNA sequencing input [36], an internal normalization standard is required. In the case of mRNA sequencing, transcripts from genes are followed and thereby the output of active gene expression. Transcription of genes is highly regulated by transcription factors and depends on the modification status of the C-terminal domains of histones and RNA polymerases and, in many organisms, by chemical modification of the DNA. Gene expression as measured by the levels of mRNA can respond quickly to stress caused by a sudden change in environmental conditions because of RNA-degradation and RNA-RNA interactions [van.Nues-2017, McKellar-2022, Iosub-2020]. In these cases, only gene transcripts involved in biological functions affected by the environmental change under study are supposed to alter while the majority of gene-expression will not be interfered with. This observation is used by many bioinformatics tools (like DESeq2 or EdgeR) to detect relative changes in protein-gene expression. The large set of unaffected, apparent constant transcripts forms an internal standard allowing comparison of RNA-Seq data for cells before and after exposure to an environmental or genetic change.
Quantification approaches of differential gene-expression (DE) by programs like DESeq2 or EdgeR are, however, not applicable to assess changes in read-numbers between libraries that cannot represent the transcriptome. Such libraries are those that have been created after enrichment of RNAs by size or by their association to a particular protein. Small RNA libraries of siRNAs also have this characteristic. Formation of siRNAs, other than miRNAs that are controlled by gene-expression, appears to occur as a response to some change in cellular exposure to harmful nucleic-acids, like invasive viral RNA or transcripts from transposons. Therefore, it can be assumed that a change in siRNA levels could be the result of a stochastic or immediate reaction triggered by conditions peculiar to a specific strain or a group of cells. Observed differences in siRNA populations between biological replicates might be an indication for this [van.Nues-202?]. By lack of evidence that siRNA levels are controlled by a well-regulated process like gene-expression, there is no internal reference, a base-line, that can be decided on. Even if that would be the case, DE-analysis of siRNAs is hampered by, compared to the number of mRNA genes, a relative low frequency of unique loci siRNAs can be mapped to and thus a low number of molecules that might be taken as ‘constant’.
Some approaches in assessing small RNA-Seq signals take as a base line the total mapped reads in a library and reads per million (RPM) of these are compared. Bedgraphs, used as input for Coalispr [35], are based on RPM values. Quantitative comparison between bedgraph signals from different experiments is, however, not always possible. When libraries differ significantly in their number of reads or in the case of considerable differences in the amount of background reads, numerical comparison does not seem to be reliable or trustworthy. Size selection of siRNAs cannot evade contamination by equally-sized break-down products of larger molecules like rRNA or tRNA which, due to their abundance, can be responsible for large (but not necessarily equally large) fractions of total read counts. Different RNA isolation methods, like size-selection of small RNAs from total RNA vs. RNA-IP with Argonaute proteins, can lead to incomparable differences in co-purified background. This makes it difficult to quantify siRNA read-counts by normalization to mapped library sizes, especially when yields of library preparations vary [36].
Experimental design decisions (inclusion of a spike-in RNA, or combining samples during cDNA synthesis) will contribute to obtain data that will be better comparable but will not address the above sketched difficulty in quantitative comparison posed by the low number of siRNA loci. Some bioinformaticians argue that the compositional (or relative) nature of count data requires that counts need to be assessed in relation to the mixture of reads in a sample. This aspect, the proportionality of counts, is inherent to the methods by which RNA-Seq libraries are generated [Quinn-2018, Quinn-2019]. Still, looking proportionally at RNA sequencing data by compositional data analysis [CoDa] is not generally done [37]; most methods take the read counts as is and try to normalize these to some standard. To turn this into a valid approach for siRNAs is not straightforward.
Sourcing ncRNAs
Identified in Cryptococcus: RNase P, U1 snRNA, 37 H/ACA and 63 Box C/D snoRNAs.
Many abundant RNA molecules, like rRNAs and small ncRNAs, form common background signals in RNA-Seq experiments. Given that most of such molecules are not or only poorly annotated, one can treat the negative control data as a resource to get an impression of the population of ncRNAs in these cells. In the case of the Cryptococcus samples, we have been able to identify the full extent of the genes for 35S pre-rRNA, a series of tRNAs, some of which had not been annotated, SRP RNA [Dumesic-2015] (Fig. 10) and - previously unidentified [38] - U1 snRNA (Fig. 11), and other biologically important molecules like RNase P, or H/ACA and box C/D snoRNAs, for example U14 or snR190, both important for processing of pre-rRNA (Fig. 12).
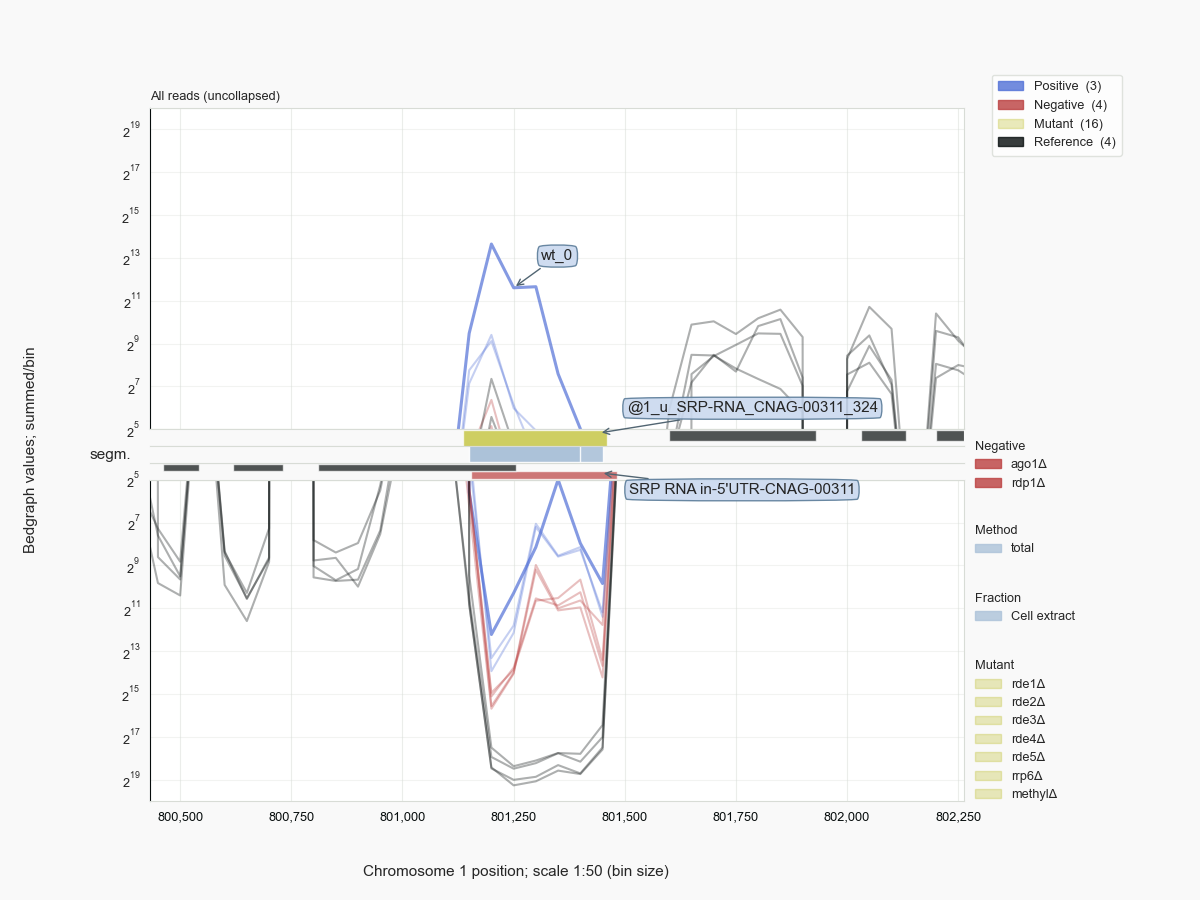

Figure 11 Hits at the CNAG_12993 locus for U1 snRNA in C. neoformans H99.
Like in other eukaryotes, cryptococcal snoRNAs are formed by transcription of snoRNA genes or are processed from introns that have been removed by splicing from precursors of protein-coding messages [Kufel-2019]. For example, U14 is encoded by the 2nd intron, snR190 by the 1rst intron in Argininosuccinate synthase genes of Cryptococcus (Fig.12) which seems conserved in related Tremellales (jelly fungi). Both snoRNAs are linked to different genes in more distant Tremellomycetes but appear in the same 5’ to 3’ order as first found in S. cerevisiae [Zagorski-1988], where it is encoded on a bicistronic transcript. In some fungal species each snoRNA is expressed from a different locus.
Genomic organization has diverged in evolution for other box C/D snoRNAs [van.Nues-2011], like for snR51, snR41 and snR70. In Saccharomyces these snoRNAs are expressed as part of a cluster that is processed (snR41-snR70-snR51). While the homologous guides for snR51 were found in separate snoRNAs (see here and here), in Tremellomycetes snR41 and snR70 derive from introns of a non-coding transcript that in the first intron expresses another snoRNA (see here).
Thus, in Cryptococcus, another source for snoRNAs is formed by non-coding transcripts that are spliced and where the sole conserved section is the intron containing the snoRNA. As a corollary, many ncRNAs for C. neoformans have been annotated with respect to their exons, while only the precursor would have been functional by providing a (conserved) snoRNA; the spliced exons do not contain conserved sequences that could point to some biological function. Of course, versatile as this organism is, also transcripts for snoRNAs are seen where one snoRNA is intronic and the other derives from an exon, e.g. in the case of CNAG_12256 with snR13 (intron) and snR45-U13/U3 (exon). Further, snoRNAs can be split by introns, even when encoded in an intron of a pre-mRNA, for example snR50-snR40l.
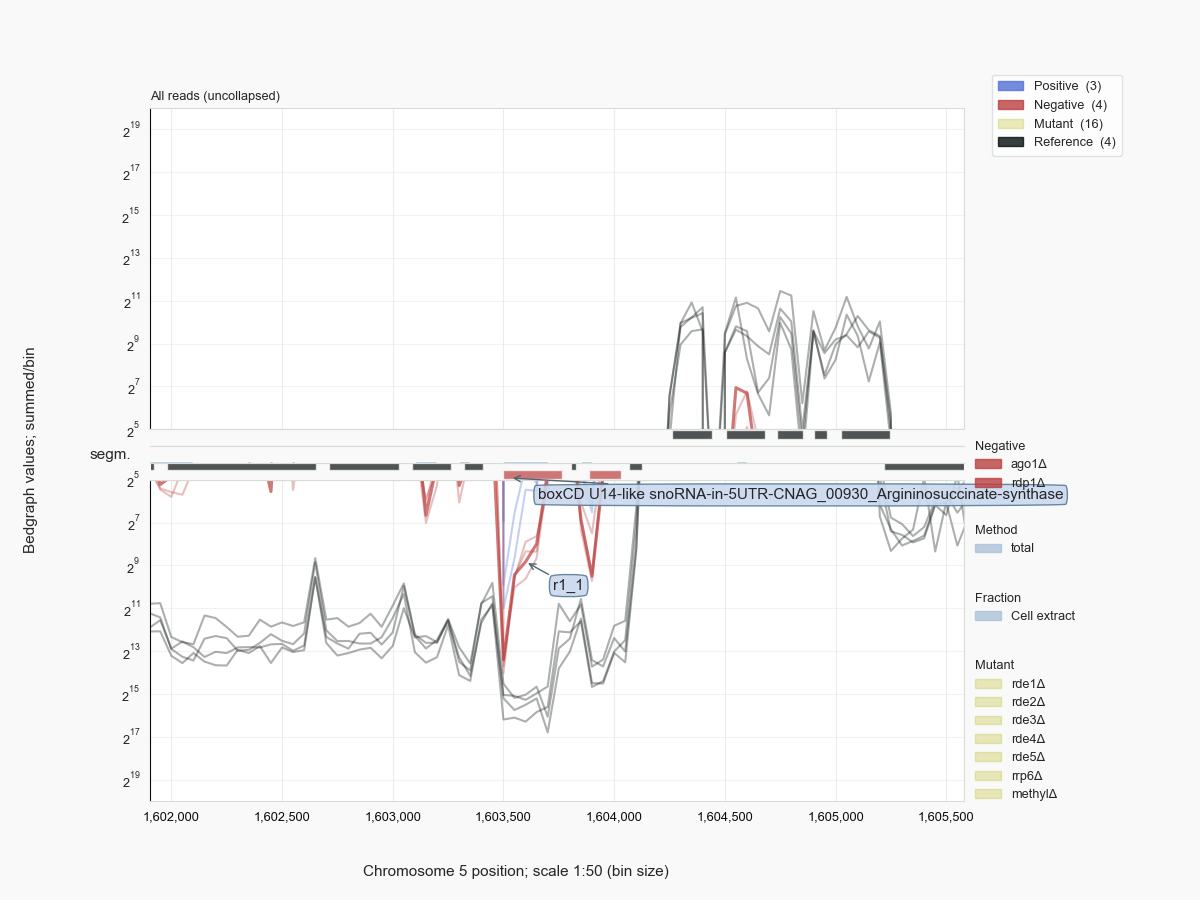
Figure 12 snR190 and U14 derive from introns of Argininosuccinate synthase in Cryptococcus.
In yeast and higher eukaryotes, acetylation of 18S rRNA nucleotides by Kre33 (NAT10) is guided by box C/D snoRNAs, snR4, or snR45 (U13) [Sharma-2017]. In Tremellomycetes, if the same cytosines in the 18S rRNA are modified by Kre33, the role of snR45 could be regulated or implemented by two different snoRNAs (snR45-U13_U3a and snR45-II), each providing a separate guide region for attachment to the substrate (see here). The first snoRNA, (snR45-U13_U3a) has a homologue (U3b) and both snoRNAs fit the Rfam signature for U3 despite variation in the secondary structure: the 5’ leader sequences upstream of the C-box in these snoRNAs from Tremellomycetes seems different from U3 in baker’s yeast where a well-conserved helical region confers base-pair interactions with 18S rRNA sequences that form an essential pseudo-knot in the mature rRNA. The extent in which these nucleotide interactions can be provided by the U3 snoRNAs of Tremellomycetes appears to vary (see here), leaving the possibility that additional events might be supported by these snoRNAs.
For some snoRNAs, for which no counterparts in other organisms were identified, no obvious base-pairing target could be identified. For example snRcnag12093 is well-conserved among Tremellomycetes [39] but putative targets did not reflect this conservation at the level of base pairing to the snoRNA guide. Methylation involves dynamic, short-lived base-pair interactions which might be hampered by stretches of sizable complementarity. As only relatively long guides (>13 bp) were checked for homology, it is possible that biological partners have been missed. For some loci, association of the snoRNA with pre-mRNA was possible nearby splice junctions or a branch-point. Provided these RNAs are able to interact, this could imply a side effect of the presence of this snoRNA on storage or processing of splicing intermediates in Cryptococcus (e.g. for L30e).
Conclusion
By incorporating negative controls in bioinformatics analysis of high-throughput datasets we could easily identify meaningful signals and obtain count data without relying on a reference with annotated regions. By doing so, it was possible to assess the variability between libraries, which exemplified difficulties inherent to common practices when applied for the comparison of small RNA-seq data. We demonstrated that coverage and abundance of ribosomal RNA fragments (rRFs) and other abundant ncRNAs are comparable between negative and positive datasets to such an extent that no biological meaning can be assigned to their co-purification with Argonaute proteins. In general, because the amplification steps during high-throughput sequencing elevate the levels of non-specific RNAs and intensify the background signals, the occurrence of rRFs or other abundant RNAs in co-purification studies require careful evaluation with respect to their biological significance; such observations might actually be highly ‘unlikely’ [Esteban-Serna] and should be checked against sequencing data obtained for appropriate negative controls (especially when the RNA-input appears to be ‘clean’) as shown here.
Although not providing information relevant for the biological system under study, negative datasets can help to annotate highly abundant RNAs and assess their roles. The RNA-Seq results for Cryptococcus species, combined with phylogenetic comparison, guided identification of a large number of snoRNAs and other ncRNAs present in these and related fungi. Many of these RNA molecules are processed from intronic sequences spliced from protein-coding pre-mRNA transcripts as found in higher eukaryotes. Novel is that some snoRNAs are derived from non-coding transcripts that are spliced but only carry sequences with significant evolutionary conservation within their introns. In these cases the precursor is functional, not the annotated spliced transcript.
At the basis for these insights was the Python application Coalispr we developed to process small RNA-Seq data for various organisms. By means of negative control data, the program provides a systematic approach to separate reads of putative biological relevance from those that form unspecific background. The program makes explicit what mostly remains hidden in experimental practicalities, the biologists’ technique to remove noise from signals.


Download essay
The essay including supporting materials can be found as a paper at bioRχiv
Addendum
In their pre-print Taheraly et. al [Taheraly-2023] described comparable findings for siRNAs targeting exons and identified similar (intronic) sn(o)RNAs in Cryptococcus neoformans.